 Soku AI
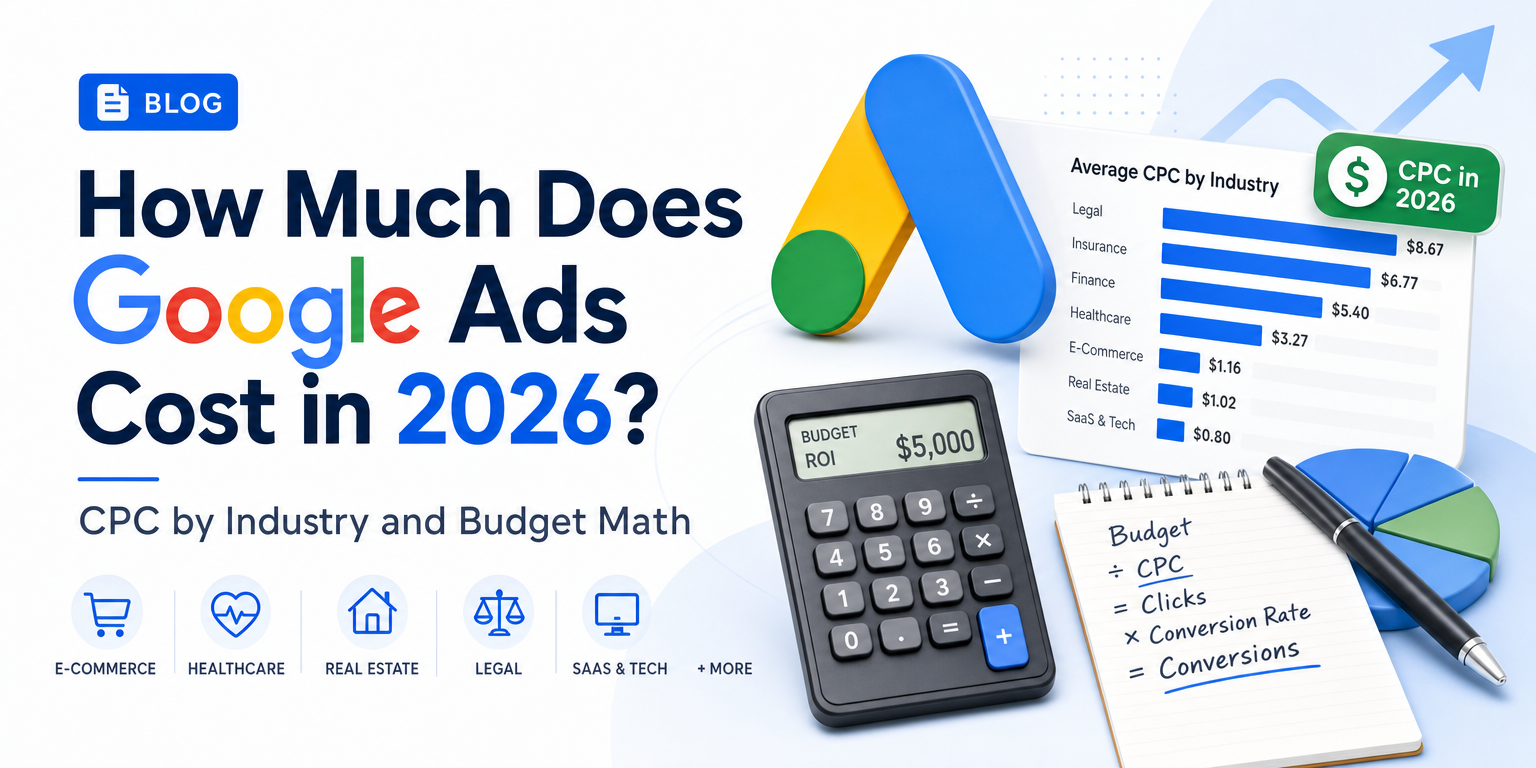
Google Ads has no fixed price. You set the budget and pay per click at auction. On the largest public dataset, WordStream by LocaliQ's 2026 benchmarks (13,474 US search campaigns, April 2025 to March 2026), the median cost per click is $5.42 and the median cost per lead is $66.69. By industry, median CPC runs from $1.63 to $9.87.
Those three numbers answer the headline question. They don't tell you what your account will cost, and most pages that rank for this query stop there. This one goes on to show the mechanics that decide your price (the auction, your budget settings, Google's billing rules) and then gives you a budget worksheet: cost per click × conversion rate → cost per conversion → monthly and daily budget, for all 23 industries in the dataset, with formulas you can rerun on your own numbers.
How this page was built (read 2026-10-07). Every benchmark comes from one named public dataset, with its period and sample. Every rule about bidding, budgets and billing comes from Google's own help center, linked where it's used. The worksheet columns marked "implied" are our arithmetic on those public medians. They are not Soku customer data and not anyone's account data. If a number has no link, it's one we calculated, and we show the formula.
This post is part of our benchmark cluster. The full multi-source reference, including what we refused to publish and why, is Paid Media Benchmarks by Industry. If you'd rather punch numbers into a form than read formulas, use the Google Ads cost calculator.
The short answer, in numbers
All figures below are from the WordStream by LocaliQ 2026 report, published May 18, 2026. Per the report's "About the data" note, the sample is 13,474 US-based search campaigns running between April 1, 2025 and March 31, 2026, with at least 52 active campaigns per subcategory, and "averages" are "technically median figures to account for outliers."
| Metric (all industries) | 2026 median | Lowest industry | Highest industry |
|---|---|---|---|
| Cost per click | $5.42 | $1.63 (Arts & Entertainment) | $9.87 (Attorneys & Legal Services) |
| Click-through rate | 6.64% | 5.56% (Auto Repair, Service & Parts) | 12.75% (Arts & Entertainment) |
| Conversion rate | 8.18% | 2.64% (Finance & Insurance) | 16.22% (Animals & Pets) |
| Cost per lead | $66.69 | $26.84 (Arts & Entertainment) | $131.63 (Attorneys & Legal Services) |
Three trend points from the same report are worth knowing before you budget:
- Costs are stable year over year, but not low. WordStream calls 2025 to 2026 "fairly stable." Over ten years, though, median CPC has more than doubled, from $2.32 in its first 2016 report to $5.42 now, and cost per lead rose from $59.18 to $66.69.
- Cost per lead fell for the first time in five years. The report notes that the industries where CPL still rose "aligned with those impacted by tariffs, including automotive and retail."
- Industry swings are large. Real Estate median CPC rose 27.27% year over year; Education & Instruction fell 22.79% and Beauty & Personal Care fell 18.95%.
This is Search-only, US-only data from one vendor's customers; the full caveats are further down, and the pillar page shows why a different dataset reports a median Google Ads CPC less than a quarter of this one.
How Google actually charges you for a click
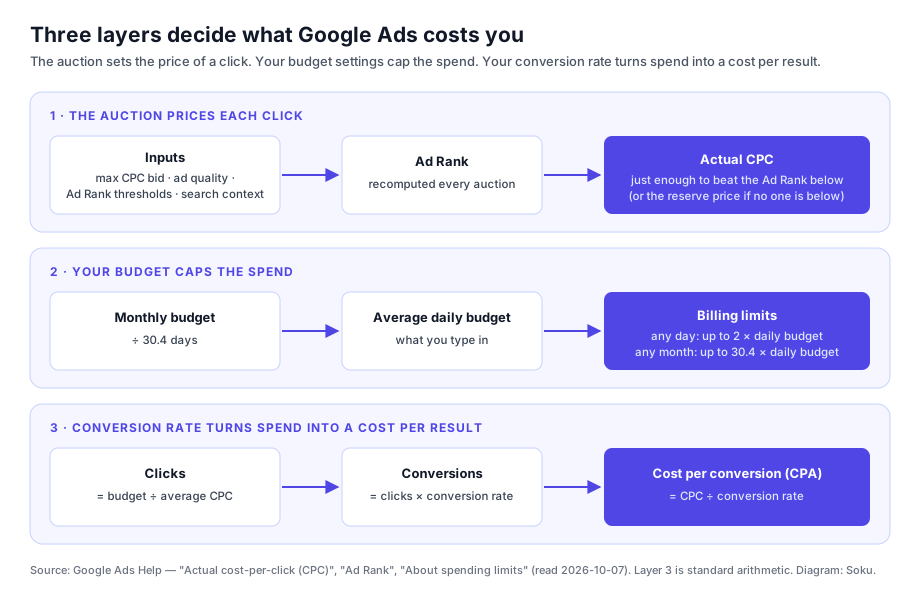
Google Ads is an auction, not a rate card. The price you pay for a click is set per search, and three layers stack on top of each other: the auction prices the click, your budget caps the spend, and your conversion rate turns spend into a cost per result.
Ad Rank decides whether you show and where
Google's Ad Rank definition lists the inputs: your bid, the quality of your ads and landing page, Ad Rank thresholds, the competitiveness of the auction, the context of the search (location, device, time, the search terms, other ads and results on the page), and the expected impact of assets and other ad formats. Ad Rank is calculated twice per auction: once to decide whether your ad is eligible, and again to rank it against other eligible ads.
Google states the practical consequence directly: "even if your competition has higher bids than yours, you can still win a higher position at a lower price by using highly relevant keywords and ads." That is the mechanism behind every "improve Quality Score to lower CPC" tip. The quality inputs change what each click costs, not just where you rank.
Actual CPC is usually less than your max CPC
Your max CPC bid is a ceiling. Your actual CPC is what you're billed. Per Google's actual CPC definition, "you only pay what's minimally required to clear the Ad Rank thresholds and beat the Ad Rank of the competitor immediately below you." If no competitor is below you, you pay the reserve price.
Google's own simplified example: five advertisers with Ad Ranks of 80, 50, 30, 10 and 5 compete, and the threshold to show above the results is 40. The advertiser at 80 pays just enough to beat 50. The advertiser at 50 pays just enough to clear the threshold of 40. Below the results, with a threshold of 8, the advertiser at 30 pays just enough to beat 10, the advertiser at 10 pays just enough to beat 8, and the advertiser at 5 doesn't show at all.
Two details from the same page change what you'll see in your account:
- Top-of-page clicks cost more by design. Google says Ad Rank thresholds, and therefore actual CPCs, "are typically higher for ads above search results," so the same keyword can cost more at the top than below the results even with no competitor below you.
- Bigger Ad Rank gaps can raise your price. As the gap between you and the next advertiser grows, Google says the higher-ranked ad "may pay a higher cost-per-click for the benefit of the increased certainty of winning," and your price is influenced by competitors further down the page, not only the one directly below.
When you can pay more than your max CPC
Google's max CPC definition says a click "won't cost you more than the maximum cost-per-click bid," with exceptions. The actual CPC page names them: Enhanced CPC and bid adjustments can push the actual CPC above your max. With automated bidding (Maximize Clicks, Maximize Conversions, Target CPA, Target ROAS), Google sets the auction-time bid for you, so your cost control moves from the bid to the budget and the target.
What your budget setting actually means
Most "why did Google spend more than I told it to" questions come from misreading the daily budget. It's an average, not a cap.
Per Google's About spending limits page, for most campaigns you'll never pay more than:
- Daily spending limit: 2 × your average daily budget on any single day.
- Monthly spending limit: 30.4 × your average daily budget in a calendar month. 30.4 is 365 ÷ 12.
Google's worked example uses a $10 daily budget: up to $20 on any one day, and no more than $304 in the month. Google's About average daily budgets page explains why: it shifts spend toward days "when you're more likely to get clicks and conversions," so some days come in under budget and others over.
Four rules from those pages that affect planning:
- To convert a monthly budget to a daily one, divide by 30.4. Google's example: $304 a month ÷ 30.4 = $10 a day.
- Mid-month changes re-pace the rest of the month. If you change the daily budget mid-month, Google paces the remaining calendar days to the new daily budget × days left. Any single day is still capped at 2× the new budget.
- Ad schedules don't shrink the monthly limit. If your ads only run weekdays, Google still paces toward 30.4 × the daily budget, which concentrates spend on the days you're live.
- Served cost can exceed the limit, billed cost can't. Google says that in rare cases served costs go over, but "you'll never pay more than these two limits." Its example: a $10/day campaign serves $23 of clicks in a day, you're billed $20, and Google covers $3. You can check the gap in the Billed cost report (served cost minus billed cost), per About overdelivery.
Campaign total budgets for fixed-length pushes
If you're running a sale or launch with a fixed amount to spend, Google's campaign total budgets work differently: you set one total and a start and end date, there's no daily spending limit, and you "will never be charged more than your total budget." Google lists them for Search, Shopping, Performance Max and Demand Gen. They're only available on new campaigns, the minimum period is 3 days, and the event window can run 3 to 90 days (up to a year for Demand Gen and YouTube).
When Google actually charges your card
On postpay billing, the timing of charges has nothing to do with the daily budget. Per Google's About Google Ads charges for postpay, you're charged whenever your costs reach your payment threshold, and on the first day of the month for whatever is left. Google's examples:
- Threshold $50, August spend $49: one $49 charge on September 1.
- Threshold $250, August spend $275: a $250 charge in August when you cross it, then $25 on September 1.
- Threshold $500, $1,500 spent in a month: three $500 charges.
Google's Change how often you're charged page adds that the threshold can rise if you keep reaching it ("if your threshold is $50 USD and you reach that amount multiple times, the threshold might raise to $200 USD or more"), and some accounts can raise it manually. For cash-flow planning, assume several charges a month on a new account rather than one invoice.
The Google Ads budget worksheet
This is the original part of the post. The formulas are standard; the table applies them to every industry in the WordStream/LocaliQ 2026 dataset so you can see what a month of Google Ads actually takes to produce a readable result.
The formulas
Clicks             = Monthly budget ÷ CPC
Conversions        = Clicks × Conversion rate
Implied CPA        = CPC ÷ Conversion rate
Budget for N conv. = N × Implied CPA
Daily budget       = Monthly budget ÷ 30.4
Worst-case day     = Daily budget × 2
Why the worksheet targets 30 conversions
You need a conversion count for the worksheet, and "however many the budget buys" isn't a plan. We use 30 conversions a month because that's the evaluation window Google itself recommends: its Target CPA documentation says "we recommend you measure performance for the last 30 days, including at least 30 conversions." Below that, a month of data is mostly noise, and you can't tell a good campaign from a lucky one.
Google doesn't present this as a spending minimum. Its Target CPA page also says advertisers "can start using Target CPA with no conversion history." So read the 30-conversion column as the budget at which a month of results is worth judging, not as the price of entry.
Worksheet: CPC × conversion rate → CPA → budget, by industry
CPC, conversion rate and reported cost per lead are WordStream/LocaliQ 2026 medians (US Search, April 2025 to March 2026). The implied CPA, 30-conversion budget and daily budget columns are our arithmetic on those medians, rounded to the dollar.
| Industry | Median CPC | Median conv. rate | Implied CPA (CPC ÷ CVR) | Reported median CPL | Budget for 30 conv./mo | Daily budget (÷ 30.4) |
|---|---|---|---|---|---|---|
| Animals & Pets | $4.06 | 16.22% | $25 | $31.50 | $751 | $25 |
| Restaurants & Food | $2.05 | 8.05% | $25 | $30.57 | $764 | $25 |
| Arts & Entertainment | $1.63 | 5.91% | $28 | $26.84 | $827 | $27 |
| Automotive — Repair, Service & Parts | $4.35 | 15.51% | $28 | $29.96 | $841 | $28 |
| Sports & Recreation | $2.77 | 7.69% | $36 | $44.26 | $1,081 | $36 |
| Education & Instruction | $4.81 | 13.14% | $37 | $77.48 | $1,098 | $36 |
| Travel | $2.14 | 5.83% | $37 | $44.70 | $1,101 | $36 |
| Automotive — For Sale | $2.27 | 6.01% | $38 | $44.26 | $1,133 | $37 |
| Physicians & Surgeons | $4.76 | 12.43% | $38 | $40.04 | $1,149 | $38 |
| Beauty & Personal Care | $4.62 | 10.35% | $45 | $39.25 | $1,339 | $44 |
| Personal Services | $7.17 | 12.34% | $58 | $54.60 | $1,743 | $57 |
| All industries | $5.42 | 8.18% | $66 | $66.69 | $1,988 | $65 |
| Industrial & Commercial | $5.87 | 8.20% | $72 | $75.19 | $2,148 | $71 |
| Dentists & Dental Services | $8.00 | 10.67% | $75 | $72.97 | $2,249 | $74 |
| Real Estate | $3.22 | 3.70% | $87 | $102.51 | $2,611 | $86 |
| Health & Fitness | $6.17 | 6.94% | $89 | $67.36 | $2,667 | $88 |
| Apparel / Fashion & Jewelry | $4.44 | 4.50% | $99 | $97.51 | $2,960 | $97 |
| Shopping, Collectibles & Gifts | $4.14 | 4.01% | $103 | $49.40 | $3,097 | $102 |
| Home & Home Improvement | $8.33 | 8.05% | $103 | $90.92 | $3,104 | $102 |
| Business Services | $5.87 | 4.85% | $121 | $93.69 | $3,631 | $119 |
| Finance & Insurance | $3.39 | 2.64% | $128 | $74.44 | $3,852 | $127 |
| Furniture | $3.97 | 2.99% | $133 | $106.70 | $3,983 | $131 |
| Attorneys & Legal Services | $9.87 | 5.55% | $178 | $131.63 | $5,335 | $175 |
| Career & Employment | $5.81 | 3.05% | $190 | $67.36 | $5,715 | $188 |
Two things stand out. First, CPC alone is a bad guide to cost. Finance & Insurance has one of the cheaper median clicks ($3.39) but the lowest conversion rate (2.64%), so its implied CPA lands near the top. Animals & Pets pays more per click ($4.06) than Finance and still ends up with the cheapest conversions because 16.22% of clicks convert. Second, the spread is wide: a readable month runs from about $750 to over $5,000 depending on the industry, before your own account's differences come in.
Worked example 1: a dental practice that wants a readable month
A dental practice wants enough volume to judge its campaign after one month, so it targets 30 conversions.
- Implied CPA: $8.00 ÷ 10.67% = $74.98
- Monthly budget: 30 × $74.98 = $2,249
- Average daily budget: $2,249 ÷ 30.4 = $74
- Clicks that buys: $2,249 ÷ $8.00 = about 281 clicks
- Worst single day Google can bill: 2 × $74 = $148
- Most Google can bill in the month: 30.4 × $74 = $2,250
If you don't know about the 2× rule, a $148 day looks like a billing error. It's working as designed.
Worked example 2: a fixed budget, what does it buy?
A home-improvement contractor has $1,500 a month and wants to know what to expect.
- Daily budget: $1,500 ÷ 30.4 = $49.34
- Clicks: $1,500 ÷ $8.33 = about 180
- Conversions: 180 × 8.05% = about 14.5
- Implied CPA: $8.33 ÷ 8.05% = $103.48
Fourteen or fifteen conversions is about half of Google's 30-conversion evaluation window. That doesn't mean $1,500 is wasted. It means the contractor should judge results over roughly two months rather than one, or narrow the campaign (fewer services, tighter geography) so the same budget concentrates on fewer, better-converting searches.
Worked example 3: start from what a customer is worth
The cleanest budget doesn't start from benchmarks at all. It starts from what you can afford to pay. As a purely hypothetical illustration: if a closed customer is worth $2,000 in gross profit and 1 in 5 leads closes, the most you can pay per lead and break even is $2,000 ÷ 5 = $400. If your landing page converts clicks at 5%, your break-even CPC is $400 × 5% = $20. Any keyword you can buy below that is profitable on paper; anything above it isn't, whatever the industry median says. For the margin version of this calculation (break-even ROAS), see the pillar's break-even section.
Sensitivity: which lever moves the budget most
Because implied CPA = CPC ÷ conversion rate, both levers move the result in direct proportion:
- A 20% rise in CPC raises CPA by 20%.
- A drop in conversion rate from 8.05% to 6% raises CPA by a factor of 8.05 ÷ 6 = 1.34, a 34% increase, with no change in what you pay per click.
That's why landing-page fixes often save more than bid fixes. If you want to sanity-check the click side separately, the CTR calculator-calculator) and CPM calculator-calculator) handle the impression-to-click math that sits upstream of this worksheet.
Why "implied CPA" doesn't match the published cost per lead
If you multiply the published medians back together, they often don't reproduce the published cost per lead. In seven of the 23 industries the two agree within 10%. In seven others they're 25% or more apart, and in two cases the gap is huge: Career & Employment's medians imply $190 per conversion against a published $67.36, and Shopping, Collectibles & Gifts implies $103 against $49.40. Education & Instruction goes the other way: $37 implied, $77.48 published.
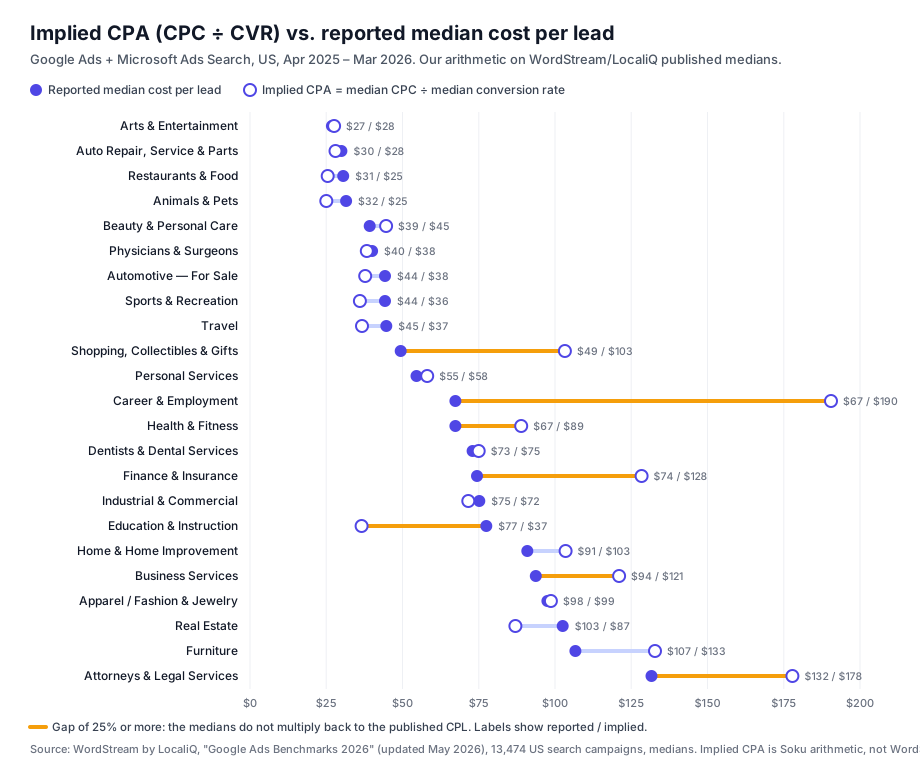
This isn't an error in WordStream's data. It's how medians work. Each column is the median of a separate distribution: the campaign with the median CPC is usually not the campaign with the median conversion rate, and neither is the campaign with the median cost per lead. A median of ratios isn't the ratio of medians. Where an industry mixes very different campaign types (job boards and recruiters in Career & Employment; gift shops and collectible sellers in Shopping), the columns describe different campaigns and the arithmetic drifts apart.
What this means for you:
- Don't plan from cost per lead alone. A published CPL is one point in a distribution, and the CPC and conversion rate behind it may describe other campaigns.
- Use the worksheet's structure, not its inputs. The formula CPC ÷ conversion rate is exact for your own account, because your CPC and conversion rate come from the same clicks. Replace the median inputs with your own as soon as you have two to four weeks of data.
- Where the two columns disagree, budget off the higher one. It's the safer assumption until your own numbers come in.
What moves your cost per click up or down
Google names the inputs (bid, ad quality, landing page, thresholds, competition, search context, assets). In practice, here's how they show up on a bill.
- Industry and keyword intent. The worksheet's CPC column spans $1.63 to $9.87 within one country and one year. Inside an industry, the gap between a research query and a "near me, today" query is often bigger.
- Position on the page. Google says thresholds, and therefore actual CPCs, are typically higher above the results than below them.
- Ad and landing-page quality. Expected CTR, ad relevance and landing page experience feed into Ad Rank, which is why a more relevant ad can win a higher position at a lower price.
- Competition in each auction. Prices rise as more advertisers clear the threshold, and as the gap between you and the next bidder widens.
- Context. Location, device and time of the search are Ad Rank inputs, so the same keyword can cost different amounts depending on where, when and on what device the search happens.
- Bid strategy. Manual CPC caps the click price; automated strategies trade that cap for a budget and a target. Enhanced CPC and bid adjustments can lift actual CPC above your max.
- Year-over-year market moves. WordStream's 2026 data shows Real Estate CPC up 27.27% and Education & Instruction down 22.79% in a single year. Your industry's price can move faster than your optimizations do.
The costs beyond media spend
The worksheet covers media cost: what Google bills you. The total cost of running Google Ads also includes whoever runs the account (your time, a freelancer, an agency retainer) and any software layered on top. We break down list prices and billing models for management tools and agencies in Google Ads Automation Pricing, so we won't repeat them here. Add that line to the budget before you compare Google Ads with any other channel.
If you're weighing Google against Meta, the auction and buying model are different, and we cover it separately in How Much Do Facebook Ads Cost?. Don't compare a Google CPC with a Facebook CPC directly. Compare cost per conversion on the same conversion definition.
What these numbers can't tell you
The worksheet is only as good as its inputs, and the inputs have limits.
- Search only. No Performance Max, Display, YouTube or Demand Gen. Those buy different inventory at different prices.
- US only, in USD. Other countries price differently.
- Google and Microsoft blended. The dataset covers both platforms' search networks.
- One vendor's customers. The panel is LocaliQ's client base, which skews small and mid-sized. Large accounts and enterprise brands aren't represented proportionally.
- "Conversion" is whatever each advertiser tracked. An account counting page views as conversions will show a much higher rate than one counting only qualified leads. Your conversion definition has to match before any comparison means anything.
- Medians, not means. Half of campaigns pay more than the median CPC. Budget toward the higher end if your market is competitive.
Google also runs its own Google Ads cost estimator, which returns typical daily budget ranges by industry and location. It's worth a look as a second opinion, but it's interactive and doesn't publish a methodology or a period on the page, so we haven't quoted any figures from it.
How to use this in practice
- Pick your row in the worksheet and note the implied CPA and the reported CPL. Plan off the higher of the two.
- Size the first month at roughly 30 × that CPA if you can, or accept a two-month read if you can't.
- Set the daily budget as monthly ÷ 30.4, and expect individual days up to 2× that.
- Launch, then replace the benchmarks with your own CPC and conversion rate after two to four weeks. Rerun the formulas, or plug your numbers into the Google Ads cost calculator.
- Track billed cost against the 30.4× ceiling in the Billed cost report, and plan cash flow around threshold charges, not a single monthly invoice.
The step most teams skip is step 4. After launch, the benchmark has done its job, and every decision from then on should use your own account's numbers.
Where Soku fits
The worksheet is easy to run once. Rerunning it every week on fresh numbers, per campaign, is the work that usually doesn't get done. Soku is an AI agent that connects to your Google Ads account and does that loop: it reads your real CPC, conversion rate and cost per conversion by campaign, flags when they drift from your own baseline, and proposes specific budget or bid changes with the old and new value shown, waiting for your approval before anything touches spend. It uses your account's numbers, not industry medians, which is the point of step 4 above.