 Soku AI
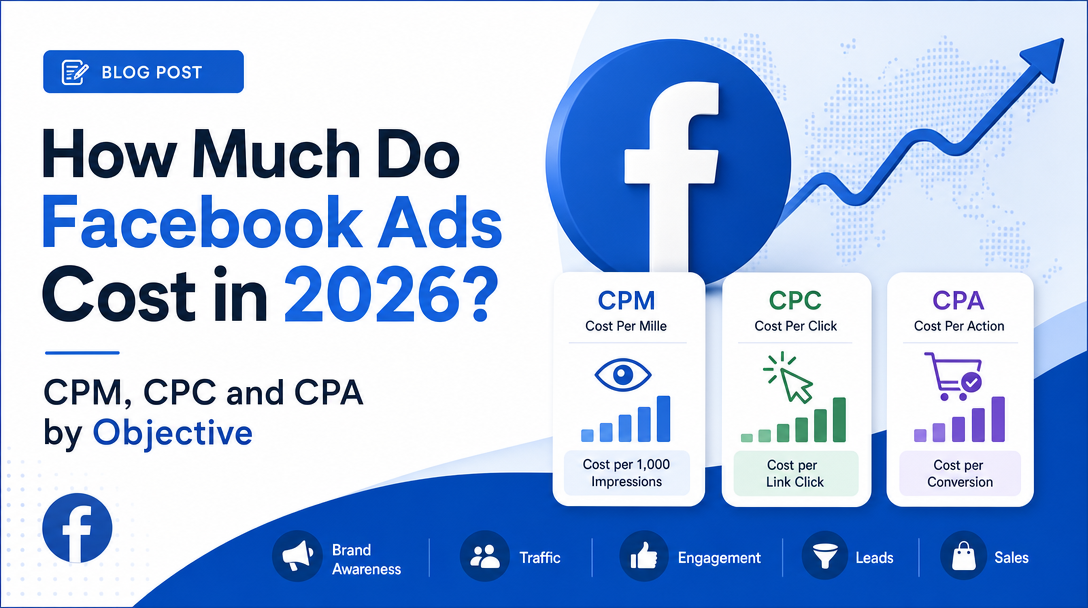
Facebook ads cost roughly $15 per 1,000 impressions, $0.60 per click on traffic campaigns, $27 per lead and $39 per e-commerce purchase in 2026. Those are published medians: CPM and CPA from Triple Whale's panel of 40,000+ e-commerce brands (Aug 2025 – Jul 2026), and CPC and cost per lead from WordStream by LocaliQ's US campaign data (Apr 2025 – Jun 2026).
That answer is accurate, and it will still mislead you if you stop there. Meta doesn't set a price for ads. You pay whatever the auction clears at, the auction charges you per impression for almost every objective, and every other number on this page is that impression price divided by how well your ads and landing pages convert. Two advertisers in the same industry paying the same CPM can end up with very different costs per sale.
So this page does three things. It gives you the 2026 numbers that actually have a named source, a period and a sample. It explains, from Meta's own documentation, how the auction and billing turn your budget into a price. And it gives you the arithmetic to go from CPM to CPC to CPA for each objective, so you can work out a budget from your own funnel and not someone else's average.
Last verified: 2026-10-07. Every benchmark below links to the page we read it from, with its period and methodology caveat. The worked examples further down are illustrative math with stated assumptions, not benchmarks, and they're labeled that way where they appear. For cross-platform benchmarks (Google, Microsoft, landing pages) and the long list of figures we refused to publish, see the pillar page: paid media benchmarks by industry. This page covers Facebook and Instagram only.
The 2026 numbers, by objective, with their sources
No single public dataset covers every Facebook objective. The two best-documented ones cover different advertisers: WordStream/LocaliQ covers US small and mid-sized businesses running traffic and leads campaigns, and Triple Whale covers e-commerce brands buying sales. Here is everything we could source, organized by what the campaign was optimizing for.
| Objective | Metric | 2026 median | Prior year | Source and period |
|---|---|---|---|---|
| Traffic | Cost per click | $0.60 | $0.70 | WordStream by LocaliQ, Apr 2025 – Jun 2026 |
| Traffic | Click-through rate | 1.93% | 1.71% | WordStream by LocaliQ, Apr 2025 – Jun 2026 |
| Leads | Cost per click | $1.80 | down 6.25% | WordStream by LocaliQ, Apr 2025 – Jun 2026 |
| Leads | Click-through rate | 2.70% | 2.59% | WordStream by LocaliQ, Apr 2025 – Jun 2026 |
| Leads | Conversion rate | 8.54% | unclear (see below) | WordStream by LocaliQ, Apr 2025 – Jun 2026 |
| Leads | Cost per lead | $27.39 | down 0.98% | WordStream by LocaliQ, Apr 2025 – Jun 2026 |
| Sales (e-commerce) | CPM | $15.06 | $13.30 | Triple Whale, Aug 2025 – Jul 2026 |
| Sales (e-commerce) | Click-through rate | 2.39% | 2.06% | Triple Whale, Aug 2025 – Jul 2026 |
| Sales (e-commerce) | Conversion rate | 1.53% | 1.60% | Triple Whale, Aug 2025 – Jul 2026 |
| Sales (e-commerce) | Cost per acquisition | $38.99 | $37.80 | Triple Whale, Aug 2025 – Jul 2026 |
| All objectives, global | Average price per ad | +12% YoY | — | Meta Q2 2026 results, Apr – Jun 2026 |
Sources: WordStream by LocaliQ, "Facebook Ads Benchmarks 2026", published September 14, 2026; Triple Whale, "Facebook Ad Benchmarks by Industry", updated August 17, 2026; Meta Reports Second Quarter 2026 Results, released July 29, 2026.
Notice the gaps. There's no sourced CPM for traffic or leads campaigns, and no sourced cost-per-result for awareness, engagement or app promotion. We looked. The figures that fill those cells on other pages trace back to aggregators quoting each other (more on that in what we left out). An empty cell is more useful to you than an invented one.
How to read each source
WordStream by LocaliQ. Traffic data: 1,377 US campaigns running April 1, 2025 to June 30, 2026, with at least 11 campaigns per industry. Leads data: 452 US campaigns over the same window, with at least 4 campaigns per industry. All "averages" are medians, in USD. These are accounts LocaliQ manages, so they lean small-business, US and local services. Two cautions: four campaigns is a very thin floor for an industry median, and the published methodology note has copy errors (it describes the campaigns as "search advertising campaigns" and gives the leads end date as "June 30, 2028"). We read those as typos, since the article itself covers Meta traffic and leads campaigns over the last year. The year-over-year change in leads conversion rate is also inconsistent: the report's summary says it rose almost 11%, while the conversion-rate section says it fell 0.98%, the same figure it gives for cost per lead. Treat the industry rows as directional.
Triple Whale. Over 40,000 brands using Triple Whale's analytics, August 1, 2025 to July 31, 2026, Facebook and Instagram combined, medians. The panel is e-commerce only, and mostly direct-to-consumer brands. It doesn't say whether its CTR counts all clicks or link clicks only, and its CPA and conversion rate depend on Triple Whale's own attribution, not Meta's. If you sell B2B software or local services, this is the wrong comparison set.
Meta's earnings release. This is the only audited number here, and it's the least specific. "Average price per ad" is total ad revenue divided by impressions across every country, placement and objective. It tells you the direction of the auction (up 12% year over year in Q2 2026, with impressions up 14%), not the CPM you should budget against.
The useful thing is that the sources agree on direction. Meta says the average ad got 12% more expensive. Triple Whale's e-commerce CPM rose 13.24%. WordStream's SMB traffic CPC fell 14% over a similar window, which looks like a contradiction until you remember that CPC is CPM divided by CTR, and WordStream's traffic CTR rose from 1.71% to 1.93%. (WordStream doesn't publish CPM, so we can't confirm what happened to its panel's impression prices.) Cheaper clicks on a pricier auction are possible, but only if your ads earn more clicks per impression.
Cost by industry: the two tables that exist
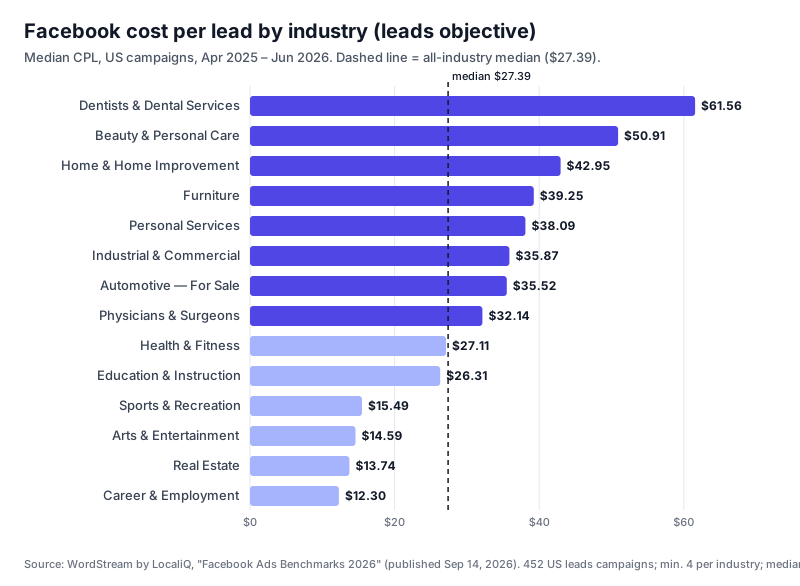
For leads campaigns, WordStream's industry spread is wide: from $12.30 per lead for Career & Employment to $61.56 for Dentists & Dental Services, a 5x range on the same objective. Traffic CPCs are tighter, from $0.34 (Arts & Entertainment) to $0.86 (Finance & Insurance).
For e-commerce, Triple Whale's industry medians run from a $26.80 CPA (E-learning & Online Courses) to $51.86 (Electronics, and Medical Devices & Equipment). CPM runs from $11.50 (Baby) to $21.80 (Health & Wellness). Sixteen of its seventeen industries saw CPM rise year over year.
| E-commerce industry (Triple Whale) | Median CPA | Median CTR | Median CVR |
|---|---|---|---|
| E-learning & Online Courses | $26.80 | 2.74% | 1.31% |
| Baby | $29.61 | 1.98% | 1.82% |
| Lifestyle & Boutique | $31.16 | 2.44% | 1.62% |
| Apparel & Accessories | $36.98 | 2.44% | 1.47% |
| Beauty | $39.31 | 2.46% | 1.79% |
| Health & Wellness | $40.53 | 3.02% | 1.50% |
| Home & Garden | $47.93 | 2.38% | 1.24% |
| Electronics | $51.86 | 2.41% | 1.13% |
A selection of rows; the full 17-industry table is on Triple Whale's page. Period: Aug 2025 – Jul 2026.
For the same caveats applied across Google, Microsoft and landing-page data, and a case study of two "benchmark" sources disagreeing by 4.3x, read the benchmarks pillar.
How Meta actually sets your price
Every number above is an output. These are the inputs, from Meta's own documentation.
The auction decides who wins
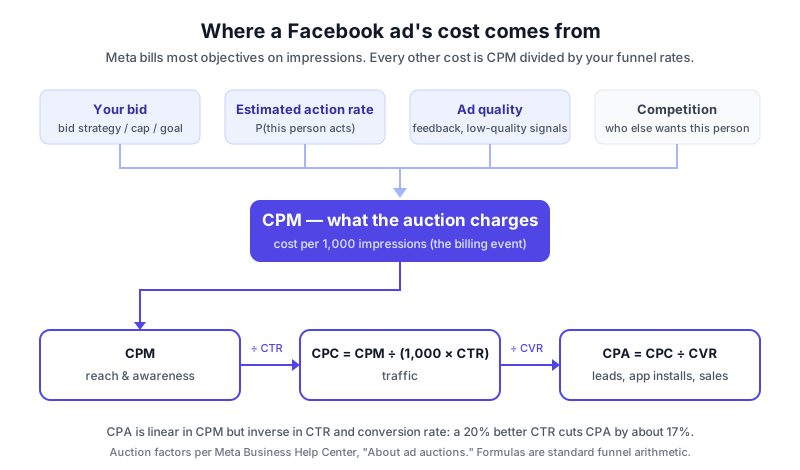
Meta runs an auction each time there's a chance to show someone an ad. Per its help center page on ad auctions, the winner is the ad with the highest total value, "subject to a price floor," and total value is "a combination of 3 major factors":
- Bid: what you're willing to pay for your desired outcome, set through your bid strategy.
- Estimated action rates: Meta's estimate of the probability that showing this ad to this person leads to the outcome you optimized for.
- Ad quality: drawn from feedback such as people hiding the ad, and from assessments of low-quality attributes like withheld information, sensationalized language and engagement bait.
Meta says estimated action rates and ad quality together measure relevance, and that "an ad that's more relevant to a person could win an auction against ads with higher bids." Meta doesn't publish the exact formula that combines the three, so be wary of any page that states one. Meta also says that auction adjustments "will not cause us to charge you more than your bid."
The practical consequence: two of the three factors are about your ad, not your money. An ad people are more likely to act on wins impressions at a lower price. That's why creative quality and conversion rate show up in your CPM, not only in your CTR.
Billing: you mostly pay for impressions
Here's the fact most cost guides skip. In Meta's Marketing API documentation on billing events, the billing options for each optimization goal are:
| What the ad set optimizes for | What you can be billed on |
|---|---|
| Reach, impressions, ad recall lift | Impressions |
| Link clicks | Link clicks or impressions |
| Landing page views | Impressions |
| ThruPlay (video) | Impressions or ThruPlay |
| Lead generation | Impressions |
| App installs | Impressions |
| Offsite conversions, value | Impressions |
So when you run a Leads or Sales campaign, you're not buying leads or sales. You're buying impressions that Meta's system aims at the people most likely to convert. Your cost per lead is simply what you spent on impressions divided by the leads that resulted. Meta does let you set a cost per result goal, but its bid strategy documentation says plainly that "adherence to cost per result goal limits is not guaranteed."
That's why CPM is the root of the chain, and why this page is organized around it.
Budgets are averages, not caps
Meta's daily budget documentation says a daily budget is a target averaged over a Sunday-to-Saturday week. On a given day Meta may spend up to 75% over it (no more than 175% of the daily budget), but never more than 7 times the daily budget in a calendar week. With ad set budget sharing turned on, Meta may also share up to 20% of the budget with other ad sets, so a single day can reach 210% of the daily budget. A lifetime budget, by contrast, is a hard cap.
There is no single minimum budget
Meta doesn't publish one universal minimum. Its minimum budget best practices say requirements depend on "business vertical, budget type, buying type, bid strategy, optimization, currency and schedule," and Ads Manager alerts you when you're below the floor. The Marketing API exposes minimums per ad account, split by impressions, high-frequency actions like clicks, low-frequency actions like app installs, and video views. Two concrete rules Meta does state:
- With a cost per result goal, your daily budget should be at least 5 times the goal. A $5 goal needs a $25 daily budget.
- If you don't want to raise the budget, optimize for an event that's easier and cheaper to get (for example, landing page views instead of purchases).
The learning phase is the real floor
The number that actually decides whether a budget is "enough" is in Meta's learning phase documentation: ad sets usually exit learning "after about 50 results in the week after the ad set's last significant edit," and during learning they "usually have a higher CPA." For goal-based bidding, Meta's bid strategy page recommends 50 to 100 or more weekly conversions.
That turns budgeting into one line of arithmetic:
Minimum weekly budget per ad set ≈ 50 × expected cost per result
Minimum daily budget per ad set ≈ (50 × expected cost per result) / 7
Run it on the published medians and you get a sense of scale (arithmetic on medians, not a recommendation for your account). At Triple Whale's $38.99 median e-commerce CPA, 50 purchases a week costs $1,949.50, about $278.50 a day per ad set. At WordStream's $27.39 median cost per lead, it's $1,369.50 a week, about $195.64 a day. That's why "start with $5 a day" advice so often ends in an ad set stuck on "Learning limited."
The cost chain: CPM to CPC to CPA
Every Facebook cost metric is one of three numbers, and they're linked by two rates you control more than you think:
CPC = CPM / (1,000 × CTR)
CPA = CPC / CVR = CPM / (1,000 × CTR × CVR)
Results per day = Daily budget / CPA
CTR here is link click-through rate (link clicks ÷ impressions), and CVR is conversions ÷ link clicks. You can check any one of these yourself with our CPM calculator and CTR calculator.
One warning before you plug benchmark medians into these formulas: medians don't multiply. Triple Whale's medians give 15.06 / (1,000 × 0.0239 × 0.0153) = $41.18, while its reported median CPA is $38.99. WordStream's leads medians give $1.80 / 0.0854 = $21.08 per lead, while its reported median CPL is $27.39. The median account for one metric isn't the median account for another, and each vendor may define clicks differently. Use the chain on your numbers. Use benchmarks only to sanity-check each link separately.
Worked budget math by objective (illustrative)
Below is one hypothetical advertiser spending $100 a day (about $3,000 a month) across four objectives. Every input in this section is an assumption chosen to make the math easy to follow. None of it is a benchmark, and none of it comes from any real account. Swap in your own numbers, or run them through the Facebook ads budget calculator.
Awareness: you're buying impressions directly
Assume a $10 CPM.
Impressions per day = $100 / $10 × 1,000 = 10,000
Impressions per week = 70,000
People reached per week = 70,000 / frequency 2.0 = 35,000
Awareness is the only objective where CPM is the whole story, so it's also the only one where a "cheap CPM" means what it sounds like. Judge it on reach and frequency, never on purchases it wasn't built to drive.
Traffic: CPM divided by CTR
Assume a $12 CPM and a 1.5% link CTR.
CPC = $12 / (1,000 × 0.015) = $0.80
Clicks per day = $100 / $0.80 = 125
If CTR falls to 1.0% at the same CPM, CPC rises to $1.20 and you get 83 clicks a day for the same spend. Traffic campaigns get cheap clicks by finding people who click, who aren't always the people who buy. Check what those visitors do on site before you scale.
Leads: one more division
Assume an $18 CPM, a 1.0% link CTR, and 10% of clickers submitting the form.
CPC = $18 / (1,000 × 0.010) = $1.80
CPL = $1.80 / 0.10 = $18.00
Leads per week = ($100 × 7) / $18.00 = 38.9
Budget for 50 leads per week = 50 × $18.00 = $900 per week ≈ $128.57 per day
At $100 a day this ad set gets about 39 leads a week, short of the roughly 50 Meta says it needs to exit learning. Either raise the budget to about $129 a day, or merge it with a similar ad set so the results pool together. Cost per lead is only half the story: a $18 lead that never answers the phone costs more than a $40 lead that books a call. Multiply CPL by your lead-to-customer rate before you compare.
Sales: where small budgets break
Assume a $15 CPM, a 1.2% link CTR and a 2.0% purchase conversion rate.
CPC = $15 / (1,000 × 0.012) = $1.25
CPA = $1.25 / 0.020 = $62.50
Purchases per week = $700 / $62.50 = 11.2
Budget for 50 purchases per week = 50 × $62.50 = $3,125 per week ≈ $446.43 per day
At $100 a day, this sales campaign produces about 11 purchases a week, far below the learning threshold. It doesn't mean Facebook "doesn't work" at this budget. It means the budget can't feed a purchase-optimized ad set. The fixes that follow from Meta's own guidance: consolidate into fewer ad sets, optimize for a higher-volume event such as add to cart until volume allows purchases, or raise the budget.
Then check the CPA against your margin. If your average order is $80 at a 55% contribution margin, you can afford $44 per first purchase. At a $62.50 CPA, each first order loses money unless repeat purchases make it back. The pillar walks through computing your break-even ROAS from your P&L, and MER vs ROAS) covers why platform-reported returns overstate the case.

Photo: Patrick Tomasso on Unsplash.
What moves your cost: a sensitivity table
This table holds the sales example fixed (CPM $15, CTR 1.2%, CVR 2.0%, base CPA $62.50) and changes one thing at a time. It's illustrative math, not a benchmark: the point is to show how hard each lever pulls, not to predict your results. The "why it moves" column cites Meta's documentation where Meta has said so, and marks our reasoning where it hasn't.
| What changes | Link in the chain | Illustrative new CPA | Change vs base | Why it moves |
|---|---|---|---|---|
| Auction 12% pricier | CPM $15.00 → $16.80 | $70.00 | +12% | Same size as Meta's reported Q2 2026 price-per-ad increase; CPA moves one-for-one with CPM |
| Peak-season auction, 30% pricier | CPM $15.00 → $19.50 | $81.25 | +30% | Hypothetical; more advertisers bidding for the same people |
| Fresher creative | CTR 1.2% → 1.5% | $50.00 | −20% | Our reasoning: higher engagement feeds estimated action rates, which also tends to lower CPM, so the real gain can be larger |
| Fatigued creative | CTR 1.2% → 0.9% | $83.33 | +33% | See creative fatigue benchmarks |
| Faster, clearer landing page | CVR 2.0% → 2.5% | $50.00 | −20% | Pure arithmetic; also improves the conversion signal Meta optimizes on |
| Slower landing page or weaker offer | CVR 2.0% → 1.5% | $83.33 | +33% | Pure arithmetic |
| Better creative and landing page together | CTR 1.5%, CVR 2.5% | $40.00 | −36% | Gains compound because both rates sit in the denominator |
| Cheaper placement, lower intent | CPM −20%, CTR −30% | $71.43 | +14% | A cheaper CPM that loses more CTR than it saves raises CPA |
| Edits that reset learning | All three, temporarily | Higher, unquantified | — | Meta: during learning, ad sets "usually have a higher CPA" |
Read down the "change vs base" column and the asymmetry is the lesson. A 12% auction increase costs you 12%. A 25% drop in CTR or conversion rate costs you 33%, and a 25% gain in both saves you 36%. The auction price is the lever you control least and it pulls the gentlest. CTR and conversion rate are the levers you control most, and they pull hardest.
The "cheaper placement" row is a common trap. A lower CPM helps only if CTR and conversion rate hold up well enough to keep CPA down. Our Audience Network breakdown works through that trade-off for the placement where it's argued about most.
Other factors that move cost, from Meta's own guidance
- Bid strategy. Highest volume spends the full budget "without guaranteeing specific cost efficiency." A cost per result goal holds cost near target but may under-spend when the auction gets competitive. A bid cap "never bids above your set amount." Each trades volume against cost (Meta, About bid strategies).
- Too many ad sets. Meta's learning phase guidance says to "avoid high ad volumes," because the system learns less about each ad set when you split budget across many. Our Meta Ads account structure guide covers how to consolidate.
- Frequent edits. Significant edits send an ad set back into learning, where CPA is usually higher.
- Optimization event. Meta notes that optimizing for purchases may need more budget than optimizing for landing page views, because the event is harder to get.
The full cost of Facebook ads is more than media
Media spend is the number this page has measured so far, but it's not the full bill. Most advertisers also pay for someone or something to run the account. That cost comes as a software subscription, a freelancer's hourly rate, or an agency retainer that's often a percentage of spend with a monthly minimum. At small budgets the management fee can exceed the ad spend. We break down those options, including the retainer floor that quietly kills small budgets, in Meta ads management pricing.
Creative is the other hidden line. Every lever in the sensitivity table that saved money (fresher creative, better CTR) assumes you can produce new ads regularly. If you budget only for media and not for creative production, CTR decays and CPA climbs to match.
For planning the whole budget across Google and Meta, with pacing and best/base/worst CPA scenarios, use the free paid media budget planning spreadsheet. If you're deciding whether Meta should get the dollars at all, ChatGPT Ads vs Google Ads vs Meta Ads compares the three auctions.
What we left out, and why
Holding to "named source, stated period, stated method" meant cutting most of what ranks for this keyword today:
| What we found | Why we cut it |
|---|---|
| "Average Facebook CPM $11.62" and "$1.14 CPC" headlines | Traced to a page whose own source list is other blog posts and aggregators, with no primary sample |
| CPM, CPC and CPA tables by objective (awareness, engagement, app installs) on several cost guides | No sample size, no date range, no named underlying study |
| "Reels and Stories CPMs are 2.5x cheaper than Feed" and similar placement multipliers | No primary source we could read |
| Q4 CPM premiums quoted anywhere from 15% to 50% | Plausible, widely repeated, never sourced to a dataset with a stated period |
| Revealbot / Bïrch public Facebook cost dashboard | Retired; the URLs now return 404 or redirect to the product homepage |
| WebFX's "average CPM around $8, CPC around $0.80" | A real survey of 250+ US marketers, but self-reported, with no survey date and stated as round approximations; too soft to sit beside measured medians |
| Triple Whale's ROAS and MER medians | Platform- and tool-attributed returns aren't comparable across accounts; the pillar explains why there is no credible industry ROAS benchmark |
| "$1 per day minimum" figures | Not in Meta's current documentation, which says minimums vary by account, objective and currency |
| Any Soku account data | We don't publish customer data. Every number on this page is from a public source or labeled as illustrative math |
If another page shows you a CPM for every objective, industry and placement, ask the four questions from the pillar: what is the sample, what period, what statistic, and what can't it be compared to?
How Soku fits
Everything on this page points the same way: the published median is a sanity check, and your own chain is the plan. That chain (CPM, link CTR, conversion rate, cost per result, and results per ad set per week against the learning threshold) is in your Ads Manager data already. It's tedious to recompute every week.
Soku is an AI agent for paid media that connects to your Meta Ads account and does that decomposition for you. When cost per result moves, it shows which link moved (the auction, the creative or the landing page), flags ad sets that can't reach about 50 results a week at their current budget, and proposes the specific change, such as consolidating ad sets or refreshing fatigued creative. Nothing touches spend until you approve it.
Related reading
- Paid media benchmarks by industry: the pillar, with sourced cross-platform benchmarks and what we discarded
- Meta ads management pricing: what it costs to have someone run the account
- Paid media budget planning spreadsheet: a free template for Google and Meta budgets
- Creative fatigue benchmarks: when CTR decay starts raising your CPA
- Facebook ads budget calculator, CPM calculator and CTR calculator: run the chain on your own numbers